
Exercising with low blood pressure: Advice and precautions

Fast-walking "super-movers" may have sharper brains as they age

Healthy breakfast ideas to support energy and metabolism

Greek yogurt: Health benefits, protein content, and how to choose the best option

Harvard study: Early sweet-drink habits tied to high blood pressure later in life

How to save money on medication

The 5 pillars of longevity: Movement, nutrition, sleep, stress reduction, and social connection

Newly approved pill cuts LDL cholesterol levels by more than half

C-reactive protein: Should healthy people be tested for it?

PRP injection for knee osteoarthritis: Does it work?
Carbohydrates — Good or Bad for You?
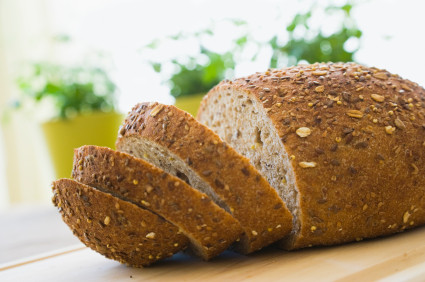
By restricting the amounts of carbohydrate that you eat, these diets claim that you can turn your body into a fat-burning machine. When you limit carbohydrates, however, you deprive your body of a main source of fuel — and many essential nutrients that you need to stay healthy.
To continue reading this article, you must log in.
Source matters. Subscribe to HarvardHealthOnline+ FREE for 30 days for unlimited access to the site – where all content is reviewed by an HMS physician or faculty expert.
With HHO+ you get these exclusive benefits:
- Unlimited access to all Harvard Health Online content
- 4 expertly curated newsletters delivered monthly
- Customized website experience aligned to your health goals
- In-depth health guides on topics like sleep, exercise, and more
- Interactive features like videos and quizzes
- Members-only access to exclusive articles and resources
SPECIAL OFFER! UNLOCK EXPERT ACCESS for 30 days FREE!
Already a member? Login ».
Disclaimer:
As a service to our readers, Harvard Health Publishing provides access to our library of archived content. Please note the date of last review or update on all articles.
No content on this site, regardless of date, should ever be used as a substitute for direct medical advice from your doctor or other qualified clinician.
Exercising with low blood pressure: Advice and precautions
Fast-walking "super-movers" may have sharper brains as they age
Healthy breakfast ideas to support energy and metabolism
Greek yogurt: Health benefits, protein content, and how to choose the best option
Harvard study: Early sweet-drink habits tied to high blood pressure later in life
How to save money on medication
The 5 pillars of longevity: Movement, nutrition, sleep, stress reduction, and social connection
Newly approved pill cuts LDL cholesterol levels by more than half
C-reactive protein: Should healthy people be tested for it?
PRP injection for knee osteoarthritis: Does it work?
Free Healthbeat Signup
Get the latest in health news delivered to your inbox!
Sign Up